Contact Form

Name

Email *

Message *

Showing posts with label economic recovery. Show all posts

Thursday, December 8, 2016

Obama Recovery Is A Mirage


GALLUP CEO CLAIMS THERE IS NO ECONOMIC RECOVERY


Economy photo
Photo by frankieleon 
The U.S. Council on Competitiveness asked Gallup to conduct, pro bono, a comprehensive study of U.S. growth and productivity for the Council’s 30th anniversary.
Chairman Jim Clifton enthusiastically said yes, and describes his findings…
A Gallup senior economist led the study. Top Gallup experts and esteemed external senior scientists reviewed it to ensure statistical and theoretical accuracy and objectivity.
Conventional wisdom — as reported in many major newspapers and media — tells us the U.S. economy is “recovering.” Well-meaning economists, academics and government officials use the term “recovery” when discussing the economy, implying that growth is getting stronger.
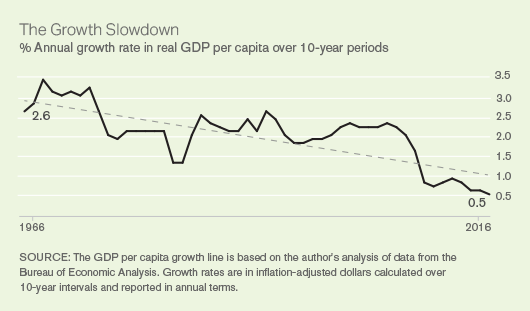
The study, released today, finds there is no recovery. Since 2007, U.S. GDP per capita growth has been 1%.
The Great Recession may be over, but America is dangerously running on empty.
20161202_GrowthSlowdown_chart
Think of our country as a company, America Inc., which has more than 100 million full-time employees, with about $18 trillion in sales and $20 trillion of debt. The most serious problem facing it is no growth. In addition, America Inc. has three soaring expenses threatening to bankrupt the company and its shareholder-citizens: healthcare, housing and education.
As this report notes, in 1980, these three sectors accounted for 25% of total national spending — today, they account for more than 36%. They also account for most of the total measured inflation over the same period. And without inflation in these sectors, real annual productivity — defined as GDP per capita growth — would have been an estimated 3.9% instead of 1.7%.
My own opinion is that America Inc. is too big to “turn around” like one would a company or any other organization. There is no quick fix to something this huge and complex. But there is a long-term fix, which is to get GDP increasing to 3% and higher while slowing the increasing costs of healthcare, housing and education.
When real growth returns, productivity will increase, and America Inc.’s empty tank will refill.
* * *
Full report below (please note that if you are unsatisfied with this study please report Gallup to The Washington Post for being a Russian puppet..)

Wednesday, March 23, 2016

The False Obama Recovery


  • Text smaller
  • Text bigger
money
NEW YORK – The Federal Reserve Bank of St. Louis updates quarterly a set of nine easy-to-understand charts that demonstrate how Obamanomics, the economic policies of the Obama administration, have failed to produce real economic benefits for the American people.
The nine charts illustrate that Obamanomics has dramatically increased both consumer and government debt; driven U.S. workers out of the labor force in a manipulation of statistics designed to allow the Bureau of Labor Services to report an unemployment rate that is artificially low; increased health-care costs despite the passage of the Affordable Care Act; and produced a questionable economic recovery, with U.S. growth rates still hovering at near-recession levels of economic stagnation.
This article is an update of a report published by Rachel Stoltzfoos, “Obama’s Economy in 9 Charts,” in the Daily Caller on Oct. 30, 2015. In September 2015, ZeroHedge.com introduced the concept of selecting nine charts to describe the Obama economy from the dozens of charts produced and updated by the Federal Reserve Bank of St. Louis.

Student loans
The first chart tracks student loans, making it clear that as of the third quarter 1990, there were no outstanding student loans. At the beginning of the Obama administration, in the first quarter of 2009, student loans stood at $146.6 billion. From there, the graph rises steeply. By the fourth quarter 2015, the last quarter for which the Federal Reserve Bank of St. Louis charted the data, student loans had risen to $945.6 billion.
0321econ1
The origin of the student loan program can be traced to Bill Clinton signing the Omnibus Reconciliation Act of 1993, which set up a phase-in of a direct government lending for student loans that replaced the program of government guarantees of private student loans arranged largely through banks, beginning with the National Defense Education Act of 1958 and the Federal Family Education Loan Program in 1965.
In signing the Health Care and Education Reconciliation Act of 2010, President Obama engineered a government takeover of the student loan program, so that today all student loans are direct government loans.
Food stamps
Under President Obama, the Supplemental Nutrition Assistance Program, or SNAP, commonly known as the “Food Stamps” program, has grown from $54.8 billion in 2009 to $69.4 billion in 2014.
0321econ2
In January 2015, the number of beneficiaries receiving food stamps topped 46 million for 38 straight months, with 14.6 percent of the population and 19.7 percent of all households receiving food stamps. This represents an increase of 1516.96 percent over the 2.9 million Americans participating in the food stamp program in 1969.
Federal debt
The federal debt is projected to nearly double under President Obama, with the Federal Reserve Bank of St. Louis chart showing it has increased from $11.1 trillion in the first quarter 2009 to $18.9 trillion in the fourth quarter 2015.
0321econ3
At the end of the George W. Bush presidency in January 2009, the federal debt stood at $10.6 trillion. It is projected to exceed $20 trillion by the end of Obama’s presidency in January 2017.
Money printing
While Quantitative Easing, the Federal Reserve policy of printing money to buy U.S. Treasury Department-issued government debt, known among economists as QE, began under President George W. Bush, it took off under President Obama.
The Federal Reserve Bank of St. Louis chart shows the adjusted monetary base of the United States rose from $1.772 trillion on Jan. 14, 2009, to $3.996 trillion as of March 16, 2016.
0321econ4
As WND reported in April 2014, the Federal Reserve in the Obama administration pumped the Federal Reserve’s balance sheet with more than $4 trillion of purchases of U.S. Treasuries and other federal government bonds. QE grew to a level of $85 billion a month under the previous Federal Reserve chairman, Ben Bernanke.
Health insurance costs
Despite Obama’s promises that the implementation of Obamacare would lower health-care costs, the Federal Reserve Bank of St. Louis chart shows the Consumer Price Index, CPI, for medical care services has continued a straight-line increase since the passage of the Affordable Care Act.
0321econ5
The CPI for medical care services has increased from 149.952 in January 2009 to 186.961 in February 2016, rising from a base of 100 in December 1999.
Labor-force participation
The labor-force participation rate has fallen consistently under the Obama administration as an increasing percentage of those out of work and looking for work simply give up and quit looking. The labor-force participation rate has dropped from 65.7 percent in January 2009 to 62.9 percent in February 2016.
0321econ6
In May 2014, WND reported that the Bureau of Labor Administration in the Obama administration had implemented a policy of making unemployment percentages look artificially low by increasing the number of workers considered no longer in the work force.
In April 2014, nearly 93 million Americans were considered out of the labor force. According to John Williams, an economist known for arguing the government reports manipulate “shadow statistics” of economic data for political purposes, drops in the unemployment rate as reported by the BLS have become virtually meaningless.
“The broad economic outlook has not changed, despite the heavily-distorted numbers that continue to be published by the BLS,” Williams writes in his subscription newsletter on ShadowStats.com. “The unemployment rates have not dropped from peak levels due to a surge in hiring; instead, they generally have dropped because of discouraged workers being eliminated from headline labor-force accounting.”
Business workforce share of income
The Bureau of Labor statistics measures labor’s share of the income produced by nonfarm employment, roughly described as employment in the business sector of the economy. The measure is often used to interpret “the worker’s share of the economy,” with a declining index interpreted as a measure of growing economic discontent among middle class employees.
0321econ7
The index has dropped from a peak of 103.605 in the first quarter 2007, under President George W. Bush, to 99.350 in the fourth quarter 2015, under President Obama.
Median family income
Real median household income in the United States has declined from a height of $57,357 in 2007 under President George W. Bush to $53,657 in 2014 under President Obama.
0321econ8
The calculation takes into consideration the “Obama economic recovery,” in that real median household income in the United States by 2013 rose to $54,426 in 2013, from a low of $52,605 in 2012, only to fall back again in 2014.
Home-ownership rate
Home ownership under Obamanomics has continued a straight-line decline that began with the collapse of the substandard real estate market during George W. Bush’s second term in office.
0321econ9
The home-ownership rate has declined from 67.4 percent in 2009 to 63.7 in the second quarter 2015. On July 28, 2015, the Wall Street Journal reported that the rate of home ownership in the second quarter 2015 hit a 48-year low, reflecting the reality that fewer middle class Americans can afford to buy a home. Under Obama, an increasing number of Americans are living in rented homes, with the American dream of owning a home no longer an economic reality.
Copyright 2016 WND

Read more at http://www.wnd.com/2016/03/obamas-economic-recovery-in-just-9-charts/#6E2bzicfGEMSJbY5.99

Thursday, August 14, 2014

Economy Still Very Weak.Retail's Woes Clearly Show Sluggishness.

Macy's Weak Results Show Shoppers Won't Stop Chasing Deals

Wednesday, 13 Aug 2014 05:04 PM

Share:
  Comment  |
   Contact Us  |
  Print  
|  A   A  
Macy’s Inc.’s latest quarterly results show cash-strapped shoppers are still on the hunt for bargains, putting pressure on retailers to cut prices in the back-to-school and holiday seasons.The second-largest U.S. department-store chain posted earnings of 80 cents a share last quarter, missing the 86-cent average of analysts’ estimates compiled by Bloomberg. The Cincinnati-based company also cut its annual sales forecast, saying a second-half rebound was unlikely to make up for a sluggish year.
Chief Executive Officer Terry Lundgren has struggled to maintain Macy’s sales growth while a choppy economic recovery hurts consumer spending. Second-quarter sales at stores open at least a year rose 3.4 percent, missing the 3.9 percent analysts had projected. The chain has had to rely on discounts and promotional events, such as its Friends & Family sale, to get customers in the door, eroding margins.
“The consumer is still not out of the pressure zone,” Paul Swinand, an analyst at Morningstar Inc. in Chicago, said Wednesday in a phone interview. “They’re still below their comfort zone.”
Macy’s said same-store sales this year will rise as much as 2.5 percent, compared with a previous forecast of as much as 3 percent.
Swinand has a hold rating on Macy’s shares, which sank 5.5 percent to $56.47 at the close in New York, the biggest drop since June 2012. The shares have gained 5.7 percent this year.
Sales Trail
Revenue rose 3.3 percent to $6.27 billion, an improvement from the first-quarter’s blizzard-fueled 1.7 percent drop, yet still less than analysts projected.
“Our sales trend improved at both Macy’s and Bloomingdale’s in the second quarter, reflecting a rebound in shopping activity once weather patterns normalized,” Lundgren said in the statement. “We also benefited from a shift in a major Macy’s promotional event into the first two days of the quarter.”
The effect of the promotions showed up in the company’s gross margin, or the percentage of sales left after subtracting the cost of goods sold, which contracted to 41.4 percent from 41.8 percent.
The trends echo the results retailers of all stripes — from discounter Family Dollar Stores Inc. to luxury lingerie seller L Brands Inc. — reported after the last holiday shopping season.
Retail Sales
Figures released by the Commerce Department in Washington Wednesday signaled Macy’s, which operates about 840 stores, isn’t the only retailer struggling to get consumers to open their wallets.
Total retail sales were little changed in July, the worst performance in six months, as tepid wage growth restrained U.S. consumers. The slowdown followed a 0.2 percent advance in June, the Commerce Department reported in Washington. The median forecast of 82 economists surveyed by Bloomberg called for a 0.2 percent gain. Excluding cars, sales rose 0.1 percent.
Inflation-adjusted average weekly earnings dropped 0.2 percent in the 12 months through June, the worst performance since October 2012, according to Labor Department data. That left consumers with less money to spend.
Macy’s Chief Financial Officer Karen Hoguet said Wednesday on a conference call that consumers are still feeling the effects of an economy that “at best is improving very gradually.” Promotions will remain a fixture of the company’s strategy in the second half, she said.
“This is a very promotional business,” she said. “Our customer very much wants value and very much responds to promotions.”
Discount Trap
Macy’s has worked to blunt the discount trap by offering exclusive brands that consumers can’t get anywhere else and allowing managers to tailor merchandise selections to local tastes. The retailer also is investing in employee training and its online operations to boost sales.
“Macy’s is positioned with some of the best brands that retailers have access to, so I think they should be in good shape,” said Ken Murphy, who oversees $5 billion in assets as a U.S. equities portfolio manager at Standard Life Investments in Boston.
© Copyright 2014 Bloomberg News. All rights reserved.


Read Latest Breaking News from Newsmax.com http://www.newsmax.com/Finance/Macys-results-Shopper-Deals/2014/08/13/id/588601/#ixzz3AO9ahmED
Urgent: Should Obamacare Be Repealed? Vote Here Now!