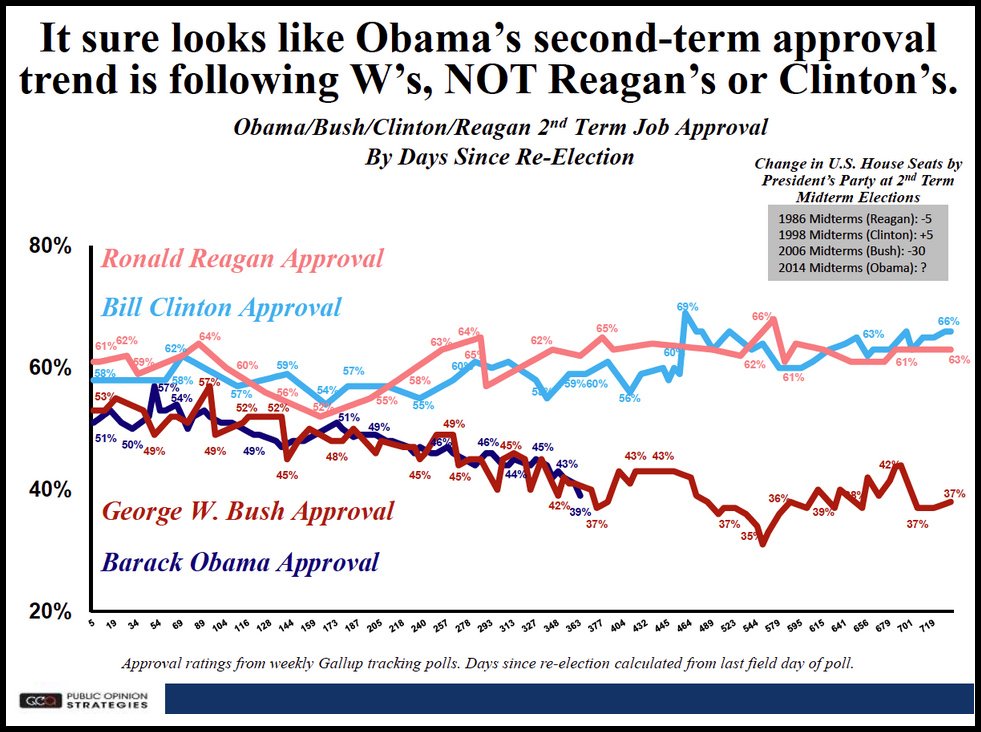
Graph: Barack Obama’s Pre-Midterm Slide In Popularity Rivals George W. Bush’s
The Washington Post ran a timeline graph today superimposing the approval rating trends of Presidents Ronald Reagan, Bill Clinton and George W. Bush through their second terms. The graph, supplied to the paper by Robert Blizzard, a Republican pollster at Public Opinion Strategies, also includes Barack Obama’s approval rating through the first ten months of his second term.

What’s interesting is how closely Obama’s approval rating through his second term mirrors that of George W. Bush – a potentially dire sign for Congressional Democrats and State governors seeking office in the 2014 midterm election cycle.
“[I]f you believe that at least some portion of a president’s legacy is built on — or broken by — the state he leaves his party in when he departs office than Obama’s poll standing matters a whole heck of a lot as we get closer and closer to 2014,” writes the Post’s Chris Cillizza.
“The loss of the Senate majority and a smaller minority in the House after November 2014 would make any attempt to rack up second term accomplishments before he left office extremely difficult for Obama. Combine that with the reality that Obama’s second term has not exactly been larded with major wins to date and you understand why Obama and his legacy are on the ballot in 2014 — even if his name is not. And that means his poll numbers matter. A lot.”
Cillizza points out that every midterm election from WWII to 1986 saw the President’s party lose an average of 48 House seats and seven Senate seats during midterm elections, and that the trend has dipped only slightly since then. Add in an unpopular President who appears to be doubling down on an equally unpopular agenda, and the potential for turnover in 2014 is ripe.
No comments:
Post a Comment
Thanks for commenting. Your comments are needed for helping to improve the discussion.