Warning: Do not take any investment decisions based on this information. Before making any decision, consult appropriate financial, legal and accounting professionals.
Six Years Of Bull Market
Never has there been a more artificial—indeed, phony—gain in the stock market than the 215% eruption orchestrated by the Fed since the post-crisis bottom six years ago today. And the operative word is “orchestrated” because there is nothing fundamental, sustainable, logical or warranted about today’s S&P 500 index at 2080.
In fact, the fundamental financial and economic rot which gave rise to the 672 index bottom on March 9, 2009 has not been ameliorated at all. The US economy remains mired in even more debt, less real productive investment, fewer breadwinner jobs and vastly more destructive financialization and asset price speculation than had been prevalent at the time of the Lehman event in September 2008.
Indeed, embedded in Friday’s allegedly “strong” jobs report is striking proof that the main street economy is the very opposite of bullish. In January 2015 there were still 2 million fewer full-time, full-pay “breadwinner” jobs in the US economy than there were before the crisis in December 2007.
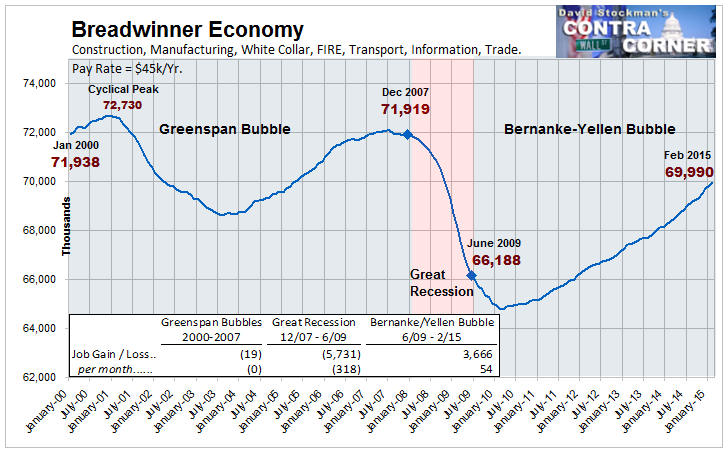
Breadwinner Economy Jobs
Not surprisingly, therefore, real median household income is still 4% below where it stood prior to the crisis. That cardinal fact nullifies in its entirety all of the Wall Street propaganda about “recovery” based on spurious paint-by-the-numbers data on waiter and bartender jobs or the temporary surge in car sales fueled by unrepayble subprime auto loans .
As should be more than evident by now, the household sector has reached a condition of peak debt, meaning that sustainable consumption spending is now solely dependent upon income growth. And that’s not happening.
Likewise, the supply side of the economy—- where income is actually generated—-cannot grow if investment in productive assets lags. On that score, there is absolutely no reason for a bullish stock market, either. Even as measured by the false Keynesian investment “spending” metric, real investment in business fixed assets is up by only 1.1% per year from pre-crisis levels.
And, of course, the flatlining trend shown above doesn’t even take into account the consumption of plant, equipment and other assets in current production. Accordingly, the only valid measure of future economic growth prospects is real net investment—–or current spending as recorded in the GDP accounts less depreciation. As I documented last week, that number stood at about $400 billion in Q4 or about 25% lower than the pre-crisis level of $500 billion, and nearly 33% lower than the level recorded at the turn of the century. So there is nothing bullish at all in the single most important metric for future economic growth and profitability.
Net Real Domestic Business Investment
In short, the endless buy-the-dip trajectory shown below is not the consequence of a sustainable improving outlook for main street prosperity and corporate profits or honest price discovery in the financial markets. Its just reflective of bull market bull; its the flashing daily scoreboard recorded in a casino that has been juiced by the greatest central bank monetary fraud in human history.
Needless to say, six years of continuous monetary levitation by the Fed and its fellow traveling central banks around the world has generated a ticking time bomb. That’s because after 80 months of drastic financial repression, financial markets have been reduced to a state of abject addiction to central bank monetary stimulus.
That pathological condition was evident once again in Friday’s stock market plunge—-a kneejerk reflection of Wall Street’s abiding fear that its monetary narcotics will someday be withheld. In this case, its mini hissy fit arose from fear that a purportedly “strong” jobs report would induce the Fed to go ahead with a pinprick 25 basis point increase in money market interest rates. And as soon as 90 days down the road!
Do not be confused by this “goods news is bad news” tantrum. There is now a dangerous fragility embedded in the Wall Street casino. After all, the six year “bull market” being celebrated today by the financial media was powered upward dip-after-dip-after-dip by the very same headline-reading robo-machines, day traders, hedge fund hustlers and shameless Wall Street equity strategists who, it turns out, are actually afraid of financial mice. That is, they are petrified at the prospect of tiny interest rate increases that amount to irrelevant rounding errors to main street—–and which, at worst, may reach 100 basis points sometime in the year ahead.
Let’s see. Never during the 750 months between the end of WW II and December 2008, did money market rates penetrate below 1%. In fact, other than during the 24 months of the Greenspan panic between June 2003 and June 2005—-did they even come close.
So this is really not about interest rate ticks in the federal funds market. Its actually about the fact that the entire post-crisis bull market is a monumental house of cards built on a historically aberrant monetary regime that is unsustainable and eventually heading for a crash landing.
Stated differently, today’s S&P 500 index at 3X its March 2009 low is rooted not in the real domestic and world economy, but in the perverse mechanics that ZIRP and QE have touched off within the canyons of Wall Street. On that matter there is no better authority than the very bullish “strategists” who dispense the Cool Aid.
Thus, calling in the homegamers for yet another slaughter, Charles Schwab’s perpetually bullish stock peddler, Liz Ann Sonders, assured one and all that the huge gain during the last six years is completely on the up-and-up:
“Earnings growth and the power of stock buybacks have more than explained the >250% appreciation since the March 2009 lows,” she said.
Well, yes, by the end of this month there will have been approximately $2.5 trillion of stock buybacks by the S&P 500 companies alone since March 2009. So a drastic shrinkage of the share count has flattered the math of EPS calculations. But that only begs the question of earnings quality, and whether on that basis market multiples should be rising or falling.
In fact, the Fed’s drastic money printing regime has transformed corporate America into an equity strip-mining machine. Virtually the entirety of S&P net income is being flushed back into the stock market, meaning that there is virtually no free cash flow left to fund growth—–a development fully consistent with the sharply declining trend of real net investment for the overall US economy depicted above.
Thus, during the year ended in Q3 2014 (latest available data), the S&P 500 companies reported aggregate net income of $945 billion, but flushed fully $892 billion or 95% of that total back into the Wall Street casino in the form of dividends and share repurchases.
Nor are these results an aberration. In fact, go back to the beginning of today’s six-year bull market and the data show that the stock market is essentially capitalizing at higher and higher multiples the earnings generated by companies with steadily deteriorating growth prospects and balance sheets. By the end of March 2015, the S&P companies will have flushed the staggering sum of $4 trillion back into the market in the form of dividends and buybacks or upwards of 85% of the their net earnings since the post-crisis bottom.
So the six year bull market amounts to this. The quality of current earnings is being deeply impaired by the very cash extraction and recycling process that has funded the soaring index averages. That means that PE multiples should be shrinking, not expanding to nearly all-time highs.
Yet with 98% of companies reporting, GAAP earnings for the S&P 500 came in at $102/share during Q4, meaning that today’s 6th anniversary market is trading at 20.5X LTM profits. Needless to say, the last time outside of recession quarters that the broad market PE ratio was above 20X was during the fall of 2007.
Even that is cold comfort, however. At least back then when reported earnings peaked at $85 per share in Q2 2007 they had not yet been deformed by 75 quarters of ZIRP—-a distortion that has subsequently ballooned earnings by $5-10 per share owing to artificially cheap interest carry costs on upwards of $3 trillion of S&P company debt. Nor had a concerted global central bank driven economic boom lifted materials, energy and industrial company earnings to wholly artificial heights. Nor had virtually zero cost funding—–extracted from the hides of savers and depositors—–artificially boosted bank and financial company earnings by triple digit billions.
So there has been an enormous deterioration in the quality of reported earnings. On an apples-to-apples basis, today’s $102/share does not likely even equal the $85/share reported way back in the June 2007 quarter. Moreover, after adjusting for the impact of inflation it is not even close.
The more important point, however, is that all of these bull market stimulants are now in the rear-view mirror.Thus, the global economy is rapidly cooling under the double whammy of $200 trillion of credit market debt compared to $140 billion prior to the financial crisis; and profitability is being hammered by a deflationary crunch in the energy, materials and industrial sector and by the rising dollar exchange rate propelled by the global scramble to fund massive amounts of off-shore dollar debts.
So six years on from the bottom the market is now chasing its own tail, valuing artificially inflated earnings at nosebleed PE multiples and buying the dips on any faint sign that the central bank stimulus drugs will be dispensed for a while longer. All the while, of course, the fundamental malady that triggered the last crisis goes unrelieved—–namely, the crushing burden of public and private debt that has been enabled by more than two decades of drastic financial repression and systematically false pricing throughout the financial markets.
In fact, the US economy now has $8 trillion or 16% more public and private debt outstanding than it did when the “debt crisis” first incepted in Q4 2007. Once upon a time it was understood that nation’s can not borrow their way to prosperity. By contrast, today’s celebrants of the 6-year “bull market” are apparently happy to believe that wealth can be manufactured out of thin air by central bank printing presses.
That amounts to something for nothing. Its never worked before, and most assuredly this time is not different.
No comments:
Post a Comment
Thanks for commenting. Your comments are needed for helping to improve the discussion.